

CNC Wire Bending · Capacity Planning
A machine’s rated speed is a single-axis number. Your real output comes from the slowest stage in a five-part cycle — plus the changeovers and losses nobody prints on the brochure. Here is how to work it out before you sign.
Direct answer: Hourly output = 3,600 ÷ cycle time per part × effective utilisation. Cycle time is the sum of feeding, bending, head rotation, cutting and unloading — minus any stages that genuinely overlap. Do not use the maximum feed speed or the advertised bends-per-minute on a datasheet. Time all five stages on a part like yours, then apply an OEE factor for availability, performance and quality. That number, not the brochure, is what you size your order around.
Rated Speed Is Not Output
When a supplier presents a CNC wire bending machine, the headline figures are almost always maximum wire feed speed, maximum bending speed in degrees per second, and axis count. Every one of those numbers is real, but every one describes a single axis running on its own under ideal conditions. A finished part does not spend its time on one axis. It passes through a sequence of separate stages, and the machine only completes a part when all of them have happened in order. The fastest feed in the world cannot help you if the head then has to rotate three times and an operator has to unload each piece by hand.
The practical consequence is easy to miss when you compare quotations. Two machines with the same advertised bending speed can deliver noticeably different output on the same part, because one indexes its head faster, or overlaps feeding with the return stroke, or unloads automatically while the next piece is being formed. Buyers who plan capacity from the datasheet routinely discover the gap only after the machine is on their floor. If you want a figure you can trust, you have to build it from the cycle itself. Our guide to which wire bending machine specifications actually matter explains which datasheet numbers are worth reading and which are marketing shorthand.
Break One Cycle Into Five Stages
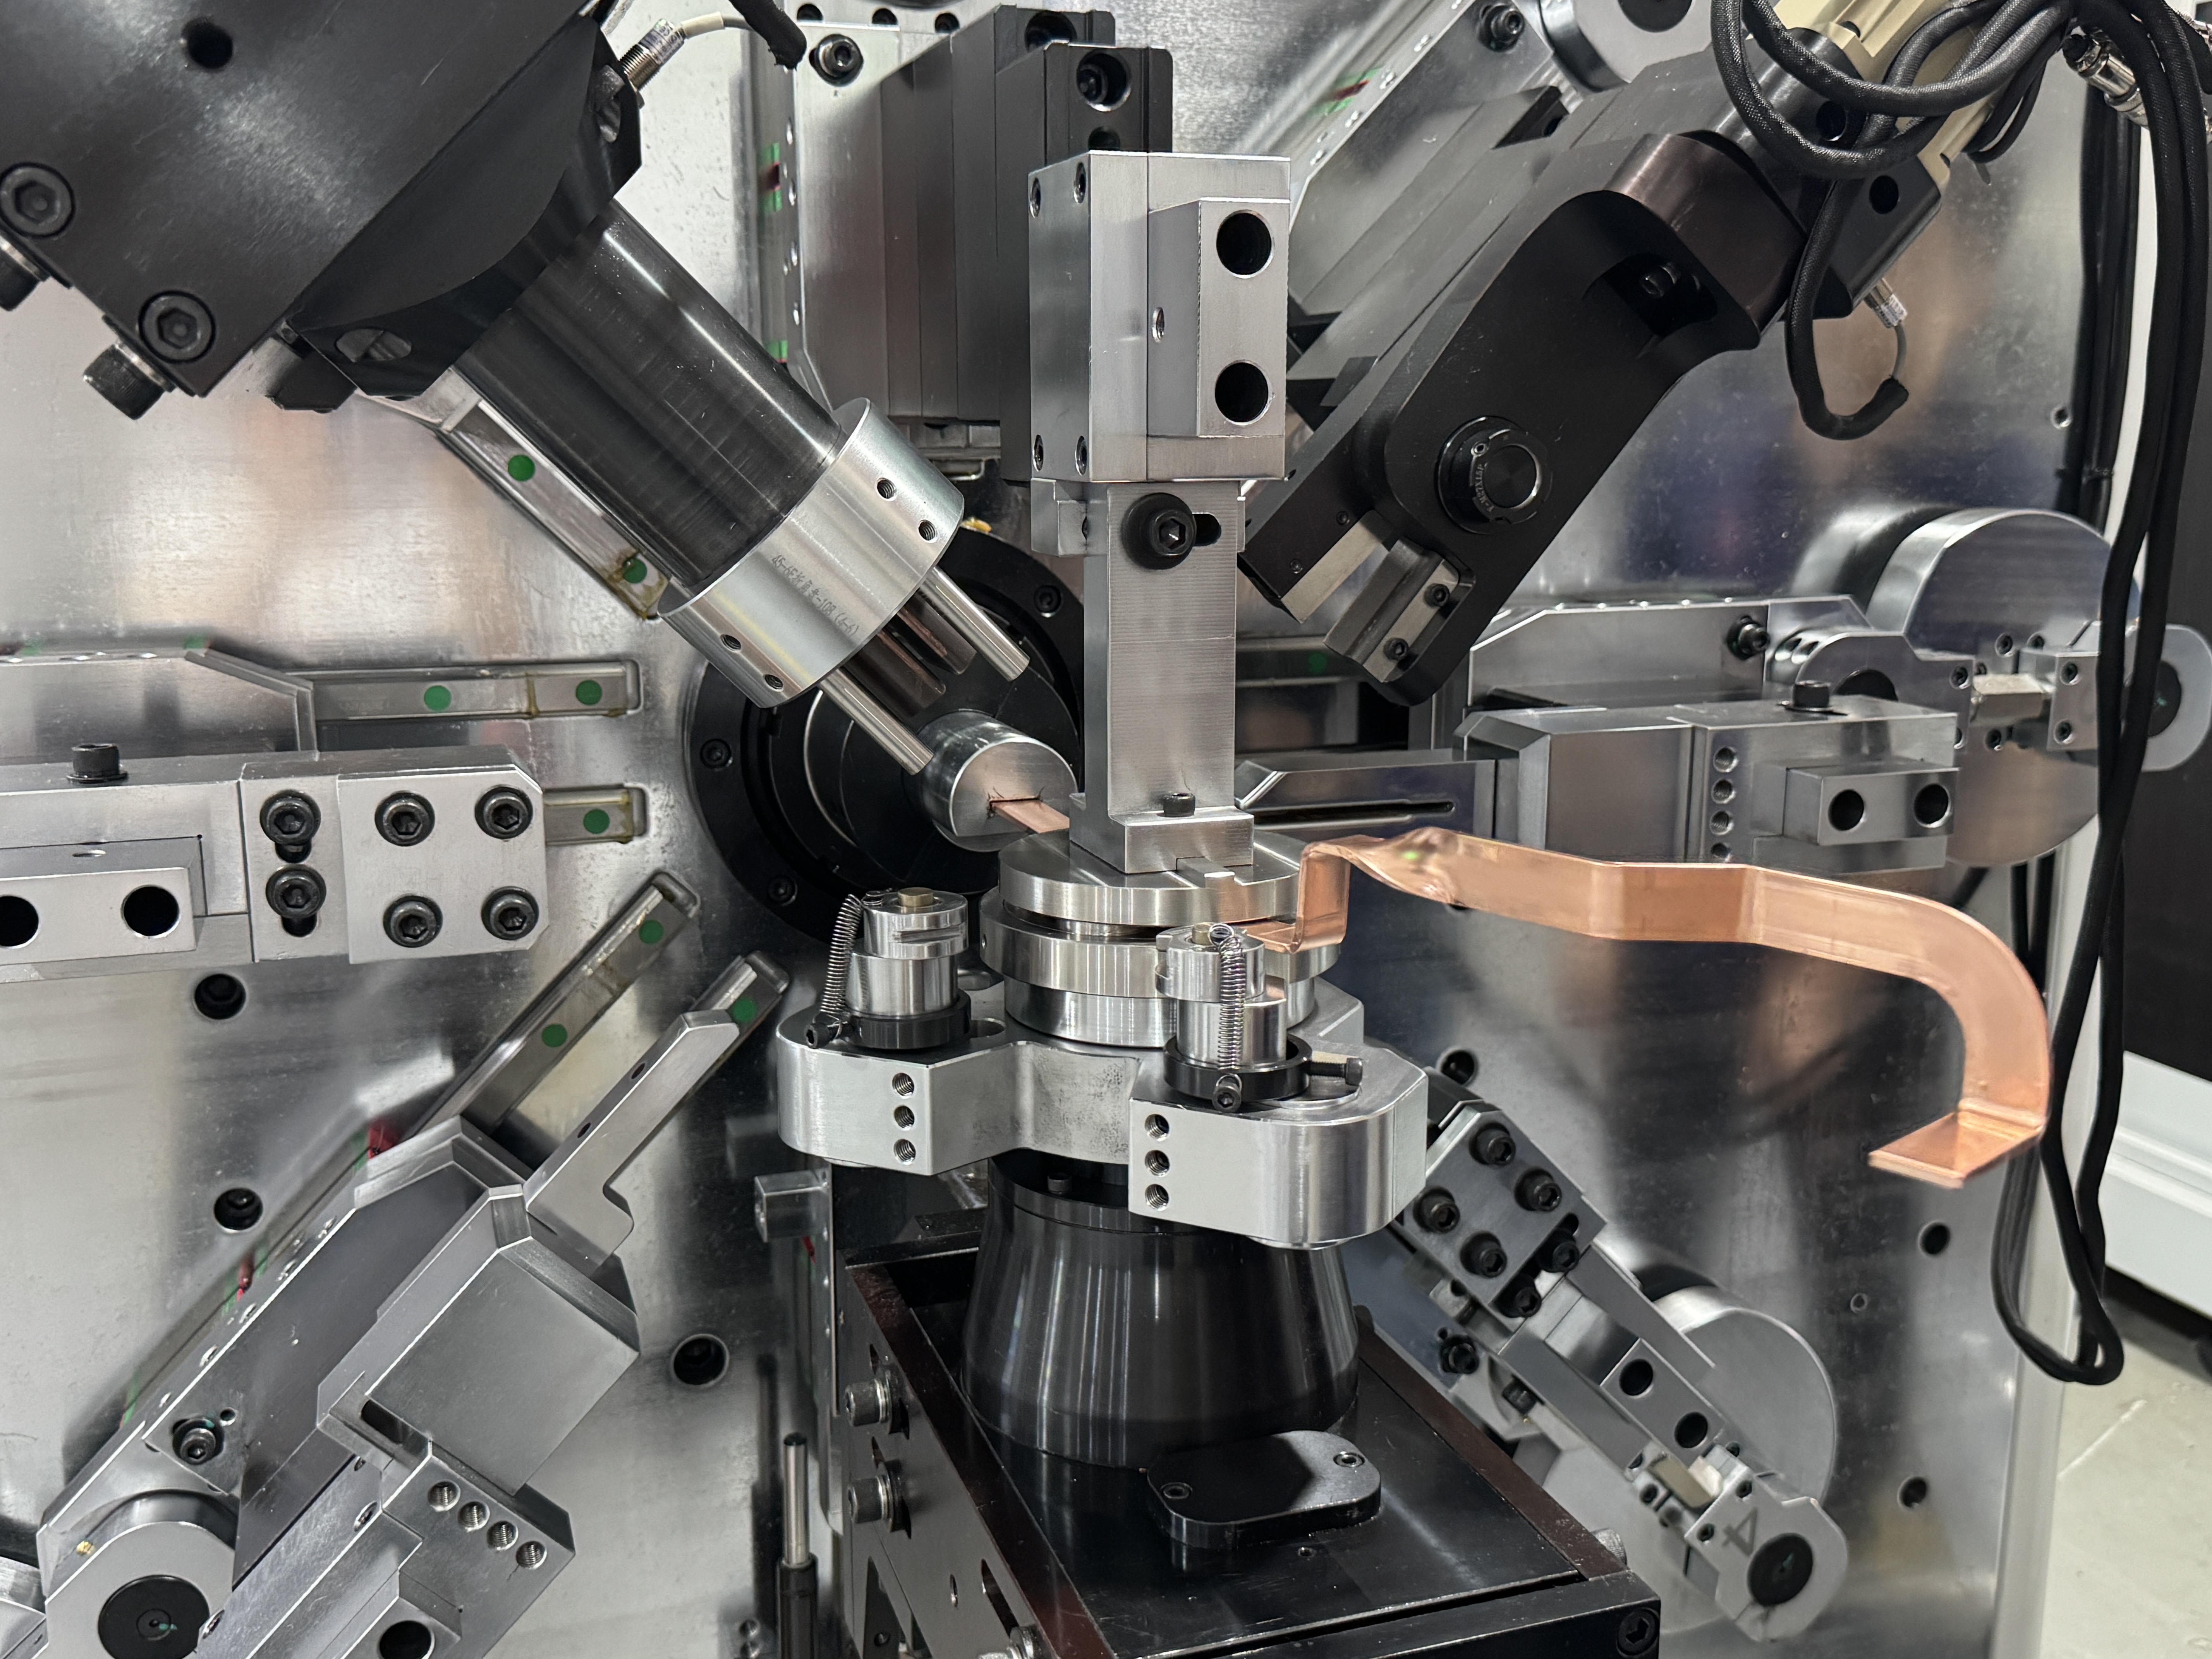
A single finished part moves through five stages. Time each one on a drawing that resembles your own before adding anything together. The table shows what to measure in each stage, what usually dominates it, and whether it can overlap with another stage on a modern control.
| Stage | What to time | Usually dominated by | Can it overlap? |
|---|---|---|---|
| Feeding & straightening | Coil to wire end positioned at the first bend | Straightening length, feed acceleration | Partly, with head return |
| Bending | Angular travel of every bend, summed | Bend count, angle size, wire grade | No, on a single head |
| Head rotation / tool change | Indexing to each new bend plane or radius tool | Number of 3D rotations, radius changes | Sometimes, with feed on advanced controls |
| Cutting | Servo cut-off time | Wire diameter and cross-section | No |
| Unloading | Part offload and cell reset | Manual versus automatic handling | Can overlap with the next feed |
Add the stages that cannot overlap, then look for the longest one. That stage is your bottleneck, and it sets the pace of the whole part. On a simple flat bracket it is often bending; on a compact three-dimensional component it is frequently head rotation; on a short, hand-unloaded batch it is the operator. Reducing anything other than the bottleneck barely moves your hourly output, which is why knowing where it sits is worth more than chasing a higher number on a specification sheet. Understanding how a CNC wire bending machine works makes these stage boundaries much easier to see.
Three Variables That Stretch the Cycle
Once you have the five stage times, three part characteristics explain most of the difference between a fast cycle and a slow one. Ask your supplier to estimate against your drawing, not against a generic demo part.
Thicker and higher-strength wire bends more slowly, needs more torque, and may need a reduced feed rate to avoid surface marking. A speed quoted on soft 2 mm wire says very little about what the same machine will do on a 10 mm spring-steel rod.
Every bend adds its angular travel time. Many small bends usually cost more than one large bend, and tight radii force the head to slow down. Bend count is the most reliable single predictor of cycle time on a flat part.
Each rotation into a new plane, and each change of bending radius, adds indexing or tool-change time. A flat two-dimensional piece with eight bends can easily outrun a three-dimensional piece with only five.
Tooling is the quiet variable behind all three. The right tool set holds radius and position through a long run, which protects both cycle time and yield; worn or mismatched tools add compensation passes and rework. This is covered in detail in our article on how tooling affects forming accuracy and consistency, and the broader choice between five-axis and six-axis machines changes how many bends you can form without reorienting the part.
Changeover Is a Hidden Tax on Short Runs
The cycle time you measure while a machine is running is only half the story. Between batches come program recall, tool and roller changes, first-piece proving runs and compensation, dimensional sign-off, and clearing the previous wire from the cell. On a long run those minutes disappear into thousands of parts. On a short run they can be the largest single cost in the whole job, yet they never appear in a quoted bends-per-minute figure.
The way to make changeover visible is to spread it across the batch: effective cycle = running cycle + (changeover time ÷ parts per batch). Fill in your own measured changeover time and your real batch size; the result is the number that belongs in your capacity plan. If you work in small batches, this single adjustment often explains why a machine that looked fast on paper cannot hit the schedule. The practical answer is usually better program and parameter management rather than a faster machine — the same discipline that keeps scrap and rework under control.
From Cycle Time to Real Hourly Output
A cycle measured on a good day assumes the machine is always available, always running at that pace, and always making good parts. Real production is not like that. OEE converts the theoretical cycle into a realistic one through three factors: availability (planned time minus stoppages), performance (actual pace versus theoretical pace), and quality (first-pass good parts divided by total parts). Multiply them to get effective utilisation, then apply it to the cycle time. Use the worksheet below with your own figures; leave the value cells blank until you have measured them.
| Item | Your value | Where it comes from |
|---|---|---|
| Theoretical cycle time (s) | ______ | Sum of the five stages |
| Availability (%) | ______ | Planned time minus breakdowns and setups |
| Performance (%) | ______ | Actual cycle versus theoretical cycle |
| Quality / first-pass yield (%) | ______ | Good parts divided by total parts |
| Effective utilisation = A × P × Q | ______ | Multiply the three factors above |
| Good parts per hour = 3,600 ÷ cycle × utilisation | ______ | Your realistic hourly output |
Be conservative with the three factors until you have your own data. A supplier who quotes output at one hundred percent availability and one hundred percent yield is describing a laboratory, not a shift. If you want to see how these output numbers feed into a per-part cost, our ROI and cost-per-part breakdown picks up exactly where this table stops.
Work Backwards From Annual Demand
Once you have a defensible good-parts-per-hour figure, sizing the order is arithmetic: machines needed = annual demand ÷ (good parts per hour × productive hours per shift × shifts per day × working days per year). Fill in your own demand and shift pattern rather than borrowing someone else’s. The result tells you whether one machine is comfortable, whether you are dangerously close to the limit, or whether the volume genuinely justifies a second unit.
Then add a margin for reality. Demand forecasts move, maintenance takes planned time, and a single machine is a single point of failure. Many buyers deliberately leave headroom rather than running a new line at its calculated maximum from day one. This is also the point at which to check the commercial side of the decision: the hidden costs of importing and the practical questions in our guide to evaluating a manufacturer both matter more when you are buying more than one unit. Because capacity planning is a commitment you will live with for years, it is worth validating your figures with a supplier who builds the machines rather than estimating from a catalogue.
When the Numbers Point to a Different Configuration
A capacity calculation often reveals that the bottleneck is structural rather than a matter of speed. That is useful, because it points to a specific configuration change instead of a vague request for a “faster machine.” If bending dominates and your parts are symmetrical or very long, a twin-head layout can process two sections in one cycle, as described in our look at double-head forming efficiency. If head rotation dominates, more controlled axes or a rotary-head design reduce the number of times you have to reorient the wire.
If unloading dominates, automatic part handling usually returns more capacity than any increase in bending speed, because it removes the operator from the critical path and lets feeding overlap with the next cycle. The wire bending machine selection guide sets out how these architecture choices differ, and the wire forming machine guide is worth reading when your parts are three-dimensional. Make the configuration follow the measured bottleneck, and you will spend the budget on the feature that actually moves your hourly output.
What to Measure Before You Request a Quote
Bring these numbers to the conversation and a supplier can give you a capacity estimate that means something. Without them, any output figure is a guess on both sides.
- ☐ Wire diameter, material grade and tensile strength of the production part
- ☐ Number of bends, bend angles and inside radii on the drawing
- ☐ Whether the part is flat 2D or needs 3D head rotation
- ☐ Measured or estimated time for each of the five cycle stages
- ☐ Typical batch size and number of changeovers per shift
- ☐ Target hourly output and total annual demand
- ☐ Shift pattern and productive hours per shift
- ☐ How parts are unloaded today — by hand or automatically
- ☐ Expected first-pass yield and the main cause of rejects
Frequently Asked Questions
Why does my machine produce less than the catalogue says?
Catalogue speeds describe one axis at its maximum, not a complete part. Your real output is limited by the slowest stage in the cycle, by changeovers between batches, and by availability, performance and yield losses. Measure a part like yours and apply those factors to get a realistic figure.
How do I calculate cycle time for a wire bending part?
Time the five stages — feeding and straightening, bending, head rotation or tool change, cutting, and unloading — on your drawing. Add the stages that cannot overlap and identify the longest one. Then add a share of the changeover time based on your batch size. The sum is your effective cycle time per part.
Does a higher axis count always mean more output?
Not necessarily. More axes can reduce head rotations and let you form complex parts in one setup, which helps when rotation is the bottleneck. On a simple flat part with few bends, extra axes add cost without changing the cycle much. Choose axes against the bottleneck you actually measured.
How much does changeover reduce effective capacity?
It depends entirely on batch size. Divide your measured changeover time by the number of parts in a batch and add the result to the running cycle. On a long run the effect is tiny; on a batch of a few dozen parts it can be the dominant cost. Short-run shops should focus on program recall and parameter reuse before buying a faster machine.
When should I buy a second machine instead of pushing the first one?
Work backwards from annual demand and the productive hours you actually have. If the required output exceeds what one machine can deliver with a reasonable margin, a second unit is safer than running the first at its limit with no room for maintenance or demand changes. Use the machines-needed formula above with your own figures.
Will automatic unloading pay for itself?
It pays when unloading is on the critical path, which is common on short, repetitive parts. Automation removes the operator from the cycle and lets feeding overlap with the next piece. On long cycles where bending clearly dominates, its effect is smaller. Decide from the five-stage breakdown, not from a general assumption.
Send Us Your Part and Volume for a Capacity Read
BELAN Machinery, a professional provider of automotive wire forming solutions. Share your part drawing, wire diameter and material, target cycle time and annual volume, and our engineering team will work through the cycle with you and outline a realistic output range and the machine architecture that fits — so you can size the order around measured capacity rather than a brochure figure.